Early Contradictions
Many different attempts have been made to try and characterize pMMO by EPR (electron paramagnetic resonance) spectroscopy. With so many attempts contradictions are likely and the first comes from Chan and Coworkers. Chan and coworkers observed a typical type 2 Cu(2) signal with a signal at g = 2.06. The hyperfine splitting pattern was interpreted as a trinulcear mixed-valence copper center consisting of one Cu(2) and 2 Cu(1) ions. Chan used his data combined with copper stoichiometry to propose that the pMMO metal centers arranged in 5-7 trinuclear clusters that fall into two functional classes, catalytic and electron transfer. (The figure to the left demonstrates how Chan viewed the active site) More current work done by other researchers contradicts these findings. Antholine and coworkers believed that the isotropic signal designated as the trinuclear copper cluster signal instead could come from a radical and a mononuclear type 2 Cu(2) center. ESEEM (Electron spin echo modulation) spectroscopic data indicates that the mononuclear type 2 Cu(2) centers are coordinated by 3 or 4 histidine imidazoles. (Crit. Rev. Biochem. Mol. Bio. 2004 May-Jun;39(3):147-64.)
Copper XANES Spectrum of Purified M. Trichosporium OB3b pMMO
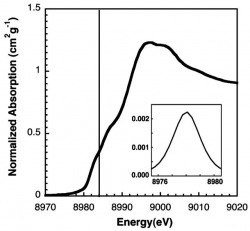
The XAS spectrum of purified M. trichosporium OB3b pMMO is shown below with pre-edge features centered at 8980 and 8984 eV. The absorption feature at 8980 eV corresponds to a 1s → 3d transition for Cu(II) and has a low area meaning Cu is partially present as Cu(I). The feature at 8984 eV is characteristic of a Cu(I) 1s → 4p transition. These results support previous conclusions that the copper in this sample is a mixture of Cu(I) and Cu(II) (Biochemistry. 2008 July 1; 47(26): 6793–6801) (XANES-X-ray absorption Near Edge Structure)
EPR of Purified M. Trichosporium OB3b pMMO
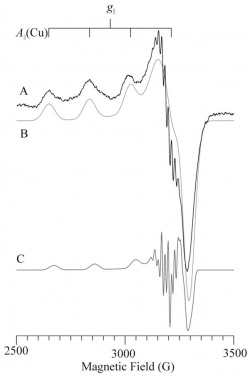
The EPR spectra shown here is more of a comparison than anything. (A) represents the experimental spectrum (B) represents a simulation of the major component with parameters as follows: g⊥ = 2.052, g|| = 2.247, A(63Cu)|| = 585 MHz, A(63Cu)⊥ = 60 MHz (C) represents a simulation of the minor component with parameters as follows: g⊥ = 2.06, g|| = 2.225, A(63Cu)|| = 585 MHz, A(63Cu)⊥ = 60 MHz. The important things to notice here include; the EPR spectrum of purified pMMO shows resolved hyperfine coupling that seem to be related to 14N nuclei, the two overlaid signals seem to show that the major component should be somewhere close to 80% of the signal, two nitrogen ligands seem to be reasonable, and lastly no signal related to a trinuclear copper center is observable contradicting EPR data from the Okura group which could have been due to a purification problem. (Biochemistry. 2008 July 1; 47(26): 6793–6801)
Copper EXAFS fittings Analysis for Purified M. trichosporium OB3b pMMO
The window labeled (A) shows the raw unfiltered EXAFS data represented by the solid black line compared to the simulations for copper bound to pMMO shown in gray. Window (B) shows the Fourier transforms of the raw EXAFS (black) and best fit simulation (gray). From this data we are lead to believe that copper bound to pMMO has an average nearest neighbor environment of Nitrogen, Oxygen, and and Copper ligands. The signal in (A) at around k~3.8 A could be from histidine imidazole scattering. Another important thing to notice in (B) is the two peaks below the bond length shifted value of 2.6 A indicating two different nearest neighbor environments. (Biochemistry. 2008 July 1; 47(26): 6793–6801)
Below is a chart with the overall metal content listed from the Rosenzweig group. One observation is in membrane bound, solubilized, and purified pMMO all contain less than .01 iron and zinc ions per protomer consistent with Okura laboratory's findings of the absence of iron. (Biochemistry. 2008 July 1; 47(26): 6793–6801)
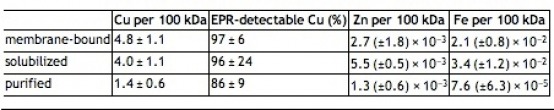
Metal Analysis of M. Trchosporium OB3b pMMO
Mossbauer spectroscopy of anaerobically purified pMMO
The Mossbauer spectra of anaerobically purified pMMO in parallel applied fields of 45 mT (A) and 8 T (B) is shown here. The solid line in A is a spectral simulation for doublet 1 which was assigned to a diamagnetic diiron(3) center (constitutes approx. 20% of Fe), and a high spin Fe2+ (approx. 18%) component. The other observable magnetic components belong to various high spin Fe3+ species. In B the solid line is a spectral simulation of the diiron(3) center, assuming S=0, equivalent sites with deltaEq= +1.05 mm/s, n=.8, and δ=.5mm/s, where n is the asymmetry parameter. The arrows show the high energy feature of the high spin ferrous component. When a second sample was exposed to oxygen identical spectra was observed. (J. Am. Chem. Soc., 2007, 129 (51), pp 15783–15785)
Citations
1. Crit. Rev. Biochem. Mol. Bio. 2004 May-Jun;39(3):147-64
2. Biochemistry. 2008 July 1; 47(26): 6793–6801
3. J. Am. Chem. Soc., 2007, 129 (51), pp 15783–15785
2. Biochemistry. 2008 July 1; 47(26): 6793–6801
3. J. Am. Chem. Soc., 2007, 129 (51), pp 15783–15785
